Consumer Insights
Uncover trends and behaviors shaping consumer choices today
Procurement Insights
Optimize your sourcing strategy with key market data
Industry Stats
Stay ahead with the latest trends and market analysis.
Base Year
Historical Year
Forecast Year


Value in AUD million
2025-2034
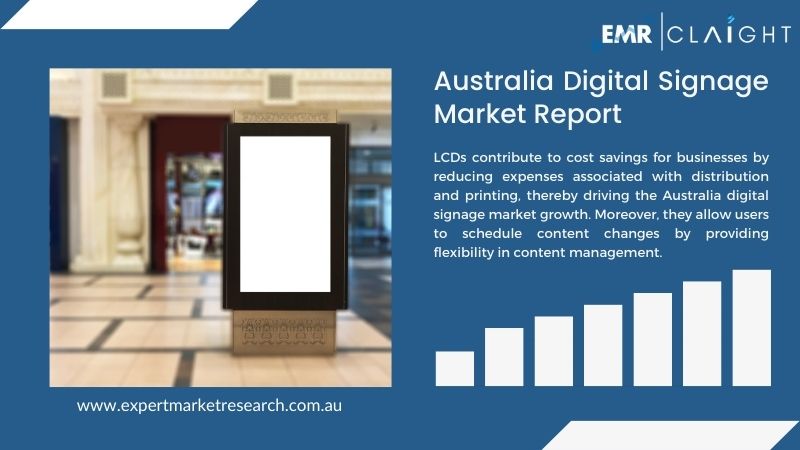
Australia Digital Signage Market Outlook
*this image is indicative*
In terms of technology, LCDs led the Australian digital signage market by capturing users' attention through animations, videos, and real-time updates.
LCDs contribute to cost savings for businesses by reducing expenses associated with distribution and printing, thereby driving the Australia digital signage market growth. Moreover, they allow users to schedule content changes by providing flexibility in content management. Further, the innovation of touchscreen LCD has enabled users to gain more personalised experiences. LED technology helps in reducing electricity bills due to less power consumption thus guiding cost-saving. The outdoor LED digital signage ensures reliable performance in changing harsh environments as they are incorporated with weather-resistant features.
| Australia Digital Signage Market Report Summary | Description | Value |
| Base Year | AUD million | 2024 |
| Historical Period | AUD million | 2018-2024 |
| Forecast Period | AUD million | 2025-2034 |
| Market Size 2024 | AUD million | 506.11 |
| Market Size 2034 | AUD million | 860.42 |
| CAGR 2018-2024 | Percentage | XX% |
| CAGR 2025-2034 | Percentage | 5.45% |
| CAGR 2025-2034 - Market by Region | New South Wales | 6.2% |
| CAGR 2025-2034 - Market by Region | Western Australia | 5.2% |
| CAGR 2025-2034 - Market by Type | Video Screen | 6.2% |
| CAGR 2025-2034 - Market by Location | Indoor | 6.0% |
| Market Share by Region | Victoria | 18.7% |
Recently, in 2024, Samsung Electronics launched the new QLED, MICRO LED, OLED and Lifestyle display integrated with AI-powered features.
Various trends and developments are guiding the development of the Australia digital signage market. The increase in personalized content delivery, such as targeted messages, is driven by the integration of artificial intelligence in digital signage. Additionally, the integration of automation tools has enabled effective real-time delivery of messages and content. Furthermore, the adoption of beacon technology has enhanced user experiences by delivering personalized, location-based content via mobile devices.
"Australia Digital Signage Market Report and Forecast 2025-2034" offers a detailed analysis of the market based on the following segments:
Market Breakup by Type
Market Breakup by Content Category
Market Breakup by Technology
Market Breakup by Component
Market Breakup by Location
Market Breakup by Screen Size
Market Breakup by Enterprise Size
Market Breakup by Application
Market Breakup by Region
Large Enterprises (LEs) hold a major share of the Australia digital signage market as they possess the financial capacity for strategic deployment, customisation, brand promotion, operational efficiency, and technological advancement.
| CAGR 2025-2034 - Market by | Region |
| New South Wales | 6.2% |
| Western Australia | 5.2% |
| Others | 4.4% |
| Victoria | XX% |
| Queensland | XX% |
| Australian Capital Territory | XX% |
The growth of the digital signage market is fuelled by personalised content delivery, interactive and touchscreen technology, integration of automation and real-time updates, integration with mobile devices, and cloud-based digital signage solutions.
*While we strive to always give you current and accurate information, the numbers depicted on the website are indicative and may differ from the actual numbers in the main report. At Expert Market Research, we aim to bring you the latest insights and trends in the market. Using our analyses and forecasts, stakeholders can understand the market dynamics, navigate challenges, and capitalize on opportunities to make data-driven strategic decisions.*
Get in touch with us today for customized, data-driven solutions tailored to your unique requirements!
The market was valued at AUD 506.11 million in 2024.
The market is projected to grow at a CAGR of 5.45% between 2025 and 2034.
The revenue generated from the digital signage market is expected to reach AUD 860.42 million in 2034.
Based on the technology, the digital signage market is bifurcated into projection, LCD, LED, and others.
Key players in the digital signage industry are LG Electronics Australia Pty Limited, Panasonic Australia Pty Limited, Signtronics Australia, Samsung Electronics Australia Pty Limited, Sony Electronics Asia Pacific Pte. Ltd., Toshiba (Australia) Pty Limited, and Icon Creations Pty Ltd., among others.
Based on components, the digital signage market is divided into software, hardware, and services.
The different locations of digital signage include indoor and outdoor.
The market is broken down into New South Wales, Victoria, Queensland, the Australian Capital Territory, Western Australia, and others.
Explore our key highlights of the report and gain a concise overview of key findings, trends, and actionable insights that will empower your strategic decisions.
| Report Features | Details |
| Base Year | 2024 |
| Historical Period | 2018-2024 |
| Forecast Period | 2025-2034 |
| Scope of the Report |
Historical and Forecast Trends, Industry Drivers and Constraints, Historical and Forecast Market Analysis by Segment:
|
| Breakup by Type |
|
| Breakup by Content Category |
|
| Breakup by Technology |
|
| Breakup by Component |
|
| Breakup by Location |
|
| Breakup by Screen Size |
|
| Breakup by Enterprise Size |
|
| Breakup by Application |
|
| Breakup by Region |
|
| Market Dynamics |
|
| Competitive Landscape |
|
| Companies Covered |
|
Our step-by-step guide will help you select, purchase, and access your reports swiftly, ensuring you get the information that drives your decisions, right when you need it.

Choose the right license for your needs and access rights.

Add the report to your cart with one click and proceed to register.

Choose a payment option for a secure checkout. You will be redirected accordingly.
Pricing Plans


One User
Five Users
Unlimited Users
Our expert team of analysts will offer full support and resolve any queries regarding the report, before and after the purchase.
Our expert team of analysts will offer full support and resolve any queries regarding the report, before and after the purchase.
We employ meticulous research methods, blending advanced analytics and expert insights to deliver accurate, actionable industry intelligence, staying ahead of competitors.
Our skilled analysts offer unparalleled competitive advantage with detailed insights on current and emerging markets, ensuring your strategic edge.
We offer an in-depth yet simplified presentation of industry insights and analysis to meet your specific requirements effectively.
We ensure that you get unmatchable competitive advantage by providing detailed insights about the existing market scenario as well as the emerging and high growth markets.
Regions and Countries with the Highest Number of Returning Clients
Projects delivered with customization
Projects involving industry specific expertise
Analysts Support
Corporates choose us as their preferred partner
Commitment to Excellence
Diverse Teams
Innovative Solutions
Client Centric Approach
Continuous Improvement

Subscribe to our Newsletter
By subscribing you agree to with our privacy policy and provide
consent to
receive
updates
from our company.

United States (Head Office)
30 North Gould Street, Sheridan, WY 82801
+1-415-325-5166
Australia
63 Fiona Drive, Tamworth, NSW
+61 448 06 17 27
India
C130 Sector 2 Noida, Uttar Pradesh 201301
+91-120-433-0800
Philippines
40th Floor, PBCom Tower, 6795 Ayala Avenue Cor V.A Rufino St. Makati City,1226.
+63 287899028, +63 967 048 3306
United Kingdom
6 Gardner Place, Becketts Close, Feltham TW14 0BX, Greater London
+44-753-713-2163
Vietnam
193/26/4 St.no.6, Ward Binh Hung Hoa, Binh Tan District, Ho Chi Minh City
+84865399124