Consumer Insights
Uncover trends and behaviors shaping consumer choices today
Procurement Insights
Optimize your sourcing strategy with key market data
Industry Stats
Stay ahead with the latest trends and market analysis.
Base Year
Historical Year
Forecast Year


Value in AUD billion
2025-2034
Australia Candy Market Outlook
*this image is indicative*
Supermarkets and hypermarkets have been driving the Australia candy market due to their product variety, convenience, and shopping preferences.
| Australia Candy Market Report Summary | Description | Value |
| Base Year | AUD billion | 2024 |
| Historical Period | AUD billion | 2018-2024 |
| Forecast Period | AUD billion | 2025-2034 |
| Market Size 2024 | AUD billion | 2.18 |
| Market Size 2034 | AUD billion | 3.17 |
| CAGR 2018-2024 | Percentage | XX% |
| CAGR 2025-2034 | Percentage | 3.80% |
| CAGR 2025-2034 - Market by Region | Australian Capital Territory | 4.3% |
| CAGR 2025-2034 - Market by Region | Queensland | 3.4% |
| CAGR 2025-2034 - Market by Type | Non-Chocolate Candy | 4.2% |
| CAGR 2025-2034 - Market by Distribution Channel | Online | 4.4% |
| Market Share by Region | Queensland | 28.2% |
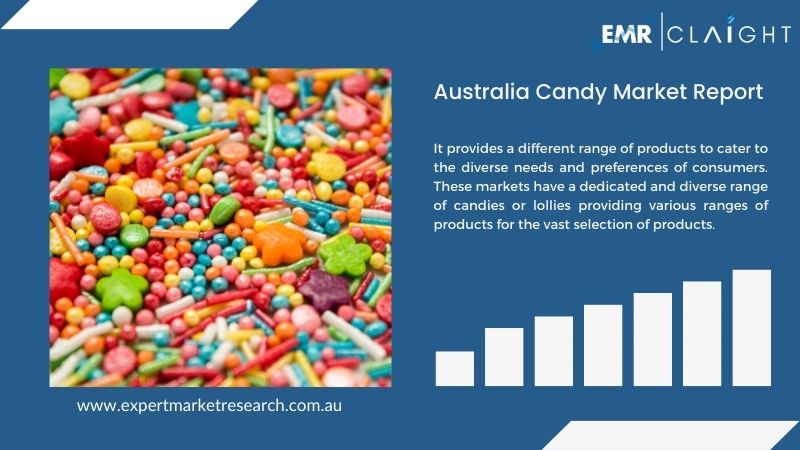
The Australia candy market is being strengthened by hypermarkets and supermarkets, which offer a wide variety of products to meet the diverse needs and preferences of consumers. These markets have a dedicated and diverse range of candies or lollies providing various ranges of products for the vast selection of products. They also display these products at seasonal events through themed displays, seasonal packaging, and special promotions, leading to an increase in Australia candy market revenue.
The growing focus on sustainable and ethical practices has led manufacturers and companies to adopt sustainable practices such as ingredients being sustainably sourced, ethical production facilities and environmentally friendly packaging materials being used to reduce carbon footprint and attract eco-conscious consumers. This has led to sustainability becoming a growing trend in the Australia candy market.
According to the Australia Bureau of Statistics, the percentage contribution of chocolate to free sugars increased to 10.4% in 2020-21.
"Australia Candy Market Report and Forecast 2025-2034" offers a detailed analysis of the market based on the following segments:
Market Breakup by Type
Market Breakup by Distribution Channel
Market Breakup by Region
Individuals favour chocolate candy for its rich taste and variety, including milk, dark, and white chocolate options, as well as filled chocolates and bars. While non-chocolate candy, such as gummies and hard candies are also preferred by individuals, therefore, chocolate candy dominates the market due to its versatile appeal and the wide range of products catering to diverse taste preferences.
| CAGR 2025-2034 - Market by | Region |
| Australian Capital Territory | 4.3% |
| Queensland | 3.4% |
| New South Wales | 3.0% |
| Victoria | XX% |
| Western Australia | XX% |
| Others | XX% |
The growth of the Candy market is fuelled by individuals preferring on-the-go snacking options as it provides convenience, manufacturers are developing convenient and innovative products with various flavours and textures.
*While we strive to always give you current and accurate information, the numbers depicted on the website are indicative and may differ from the actual numbers in the main report. At Expert Market Research, we aim to bring you the latest insights and trends in the market. Using our analyses and forecasts, stakeholders can understand the market dynamics, navigate challenges, and capitalize on opportunities to make data-driven strategic decisions.*
Get in touch with us today for customized, data-driven solutions tailored to your unique requirements!
The market is projected to grow at a CAGR of 3.80% between 2025 and 2034.
Based on the type, the candy market is bifurcated into chocolate candy and non-chocolate candy.
Key players in the industry are Nestlé Australia Ltd, Stuart Alexander & Co Pty Ltd., HARIBO Australia, AustSweetCo., Coffs Candy Kitchens, Johnson's Quality Maid Confectionery and Walkers Candy Co. among others.
The different distribution channels in the candy market include supermarkets and hypermarkets, convenience stores, speciality stores, online and others.
The market is broken down into New South Wales, Victoria, Queensland, Australian Capital Territory, and Western Australia, and others.
In 2024, the Australia candy market reached an approximate value of AUD 2.18 billion.
The market is estimated to witness healthy growth in the forecast period of 2025-2034 to reach a value of around AUD 3.17 billion by 2034.
Explore our key highlights of the report and gain a concise overview of key findings, trends, and actionable insights that will empower your strategic decisions.
| Report Features | Details |
| Base Year | 2024 |
| Historical Period | 2018-2024 |
| Forecast Period | 2025-2034 |
| Scope of the Report |
Historical and Forecast Trends, Industry Drivers and Constraints, Historical and Forecast Market Analysis by Segment:
|
| Breakup by Type |
|
| Breakup by Distribution Channel |
|
| Breakup by Region |
|
| Market Dynamics |
|
| Competitive Landscape |
|
| Companies Covered |
|
Our step-by-step guide will help you select, purchase, and access your reports swiftly, ensuring you get the information that drives your decisions, right when you need it.

Choose the right license for your needs and access rights.

Add the report to your cart with one click and proceed to register.

Choose a payment option for a secure checkout. You will be redirected accordingly.
Pricing Plans


One User
Five Users
Unlimited Users
Our expert team of analysts will offer full support and resolve any queries regarding the report, before and after the purchase.
Our expert team of analysts will offer full support and resolve any queries regarding the report, before and after the purchase.
We employ meticulous research methods, blending advanced analytics and expert insights to deliver accurate, actionable industry intelligence, staying ahead of competitors.
Our skilled analysts offer unparalleled competitive advantage with detailed insights on current and emerging markets, ensuring your strategic edge.
We offer an in-depth yet simplified presentation of industry insights and analysis to meet your specific requirements effectively.
We ensure that you get unmatchable competitive advantage by providing detailed insights about the existing market scenario as well as the emerging and high growth markets.
Regions and Countries with the Highest Number of Returning Clients
Projects delivered with customization
Projects involving industry specific expertise
Analysts Support
Corporates choose us as their preferred partner
Commitment to Excellence
Diverse Teams
Innovative Solutions
Client Centric Approach
Continuous Improvement

Subscribe to our Newsletter
By subscribing you agree to with our privacy policy and provide
consent to
receive
updates
from our company.
United States (Head Office)
30 North Gould Street, Sheridan, WY 82801
+1-415-325-5166
Australia
63 Fiona Drive, Tamworth, NSW
+61 448 06 17 27
India
C130 Sector 2 Noida, Uttar Pradesh 201301
+91-120-433-0800
Philippines
40th Floor, PBCom Tower, 6795 Ayala Avenue Cor V.A Rufino St. Makati City,1226.
+63 287899028, +63 967 048 3306
United Kingdom
6 Gardner Place, Becketts Close, Feltham TW14 0BX, Greater London
+44-753-713-2163
Vietnam
193/26/4 St.no.6, Ward Binh Hung Hoa, Binh Tan District, Ho Chi Minh City
+84865399124