Consumer Insights
Uncover trends and behaviors shaping consumer choices today
Procurement Insights
Optimize your sourcing strategy with key market data
Industry Stats
Stay ahead with the latest trends and market analysis.
Base Year
Historical Year
Forecast Year


Value in AUD million
2025-2034
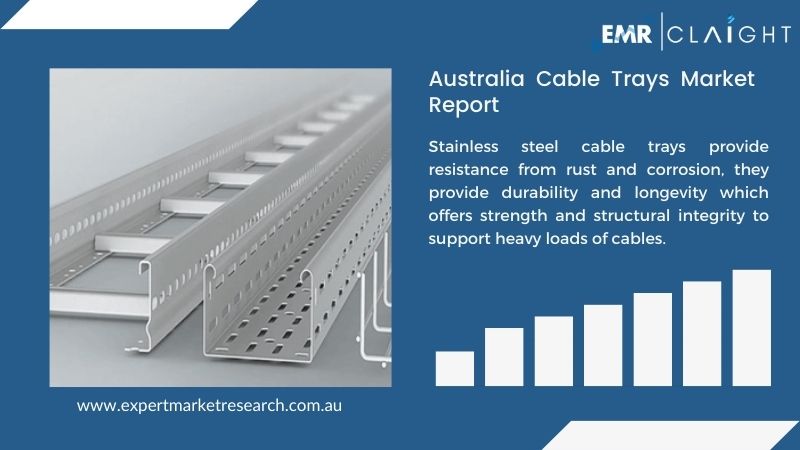
Australia Cable Trays Market Outlook
*this image is indicative*
Based on the material, the Australia cable trays market is driven by stainless steel as it provides super corrosion resistance, durability, and high strength.
The growth of the Australia cable trays market is further augmented by the rising demand for stainless steel cable trays providing resistance from rust and corrosion. They provide durability and longevity which offers strength and structural integrity to support heavy loads of cables. It is an environmentally friendly and sustainable material that contributes to green building initiatives and reduces emissions which minimizes environmental impact.
| Australia Cable Trays Market Report Summary | Description | Value |
| Base Year | AUD million | 2024 |
| Historical Period | AUD million | 2018-2024 |
| Forecast Period | AUD million | 2025-2034 |
| Market Size 2024 | AUD million | 143.12 |
| Market Size 2034 | AUD million | 253.90 |
| CAGR 2018-2024 | Percentage | XX% |
| CAGR 2025-2034 | Percentage | 5.90% |
| CAGR 2025-2034 - Market by Region | Western Australia | 7.1% |
| CAGR 2025-2034 - Market by Region | Australian Capital Territory | 6.5% |
| CAGR 2025-2034 - Market by End Use | IT and Telecom | 6.8% |
| CAGR 2025-2034 - Market by Material | Aluminium | 6.6% |
| Market Share by Region 2024 | Queensland | 20.5% |
The growing focus on sustainability and eco-friendly solutions has engaged manufacturers to integrate recyclable materials and energy-efficient manufacturing processes to reduce carbon emissions and meet green building standards.
According to the Australian Bureau of Statistics, the dwelling units approved have increased by 3.4% and 3.3% in Western Australia and Queensland respectively in January 2024.
"Australia Cable Trays Market Report and Forecast 2025-2034" offers a detailed analysis of the market based on the following segments:
Market Breakup by Type
Market Breakup by Material
Market Breakup by Finishing
Market Breakup by End Use
Market Breakup by Region
Cable trays are widely used in the IT and Telecom sectors as these industries rely heavily on robust and organised cable management systems to support extensive network infrastructure, data centres, and communication facilities. Cable trays provide an efficient solution for managing the vast number of cables required for data transmission, power distribution, and communication lines.
| CAGR 2025-2034 - Market by | Region |
| Western Australia | 7.1% |
| Australian Capital Territory | 6.5% |
| Victoria | 6.1% |
| New South Wales | XX% |
| Queensland | XX% |
| Others | XX% |
The growth of the cable trays market is fueled due to the increasing innovation in products by manufacturers, they develop sustainable and eco-friendly products which provide durability and longevity.
*While we strive to always give you current and accurate information, the numbers depicted on the website are indicative and may differ from the actual numbers in the main report. At Expert Market Research, we aim to bring you the latest insights and trends in the market. Using our analyses and forecasts, stakeholders can understand the market dynamics, navigate challenges, and capitalize on opportunities to make data-driven strategic decisions.*
Get in touch with us today for customized, data-driven solutions tailored to your unique requirements!
In 2024, the Australia cable trays market reached an approximate value of AUD 143.12 million.
The market is estimated to witness healthy growth in the forecast period of 2025-2034 to reach a value of around AUD 253.90 million by 2034.
The market is projected to grow at a CAGR of 5.90% between 2025 and 2034.
Based on the type, the cable trays market is bifurcated into ladder, trough, wire mesh, and single rail.
Key players in the industry are Legrand Australia Pty Ltd, B&R Enclosures Pty Ltd, Korvest Ltd, Atkore International Inc, Electrix International Ltd, Kounis Group Pty Ltd, Brilltech Engineers Pvt. Ltd, Flexistrut Australia, Phoenix Steel Sales Pty Ltd and Cableaway Pty Ltd among others.
Based on material, the cable trays market is divided into steel, aluminium, and stainless steel.
The different end-use in the cable trays market include power, construction, manufacturing, IT, and telecom.
The market is broken down into New South Wales, Victoria, Queensland, Australian Capital Territory, and Western Australia, and others.
Explore our key highlights of the report and gain a concise overview of key findings, trends, and actionable insights that will empower your strategic decisions.
| Report Features | Details |
| Base Year | 2024 |
| Historical Period | 2018-2024 |
| Forecast Period | 2025-2034 |
| Scope of the Report |
Historical and Forecast Trends, Industry Drivers and Constraints, Historical and Forecast Market Analysis by Segment:
|
| Breakup by Type |
|
| Breakup by Material |
|
| Breakup by Finishing |
|
| Breakup by End Use |
|
| Breakup by Region |
|
| Market Dynamics |
|
| Competitive Landscape |
|
| Companies Covered |
|
Our step-by-step guide will help you select, purchase, and access your reports swiftly, ensuring you get the information that drives your decisions, right when you need it.

Choose the right license for your needs and access rights.

Add the report to your cart with one click and proceed to register.

Choose a payment option for a secure checkout. You will be redirected accordingly.
Pricing Plans


One User
Five Users
Unlimited Users
Our expert team of analysts will offer full support and resolve any queries regarding the report, before and after the purchase.
Our expert team of analysts will offer full support and resolve any queries regarding the report, before and after the purchase.
We employ meticulous research methods, blending advanced analytics and expert insights to deliver accurate, actionable industry intelligence, staying ahead of competitors.
Our skilled analysts offer unparalleled competitive advantage with detailed insights on current and emerging markets, ensuring your strategic edge.
We offer an in-depth yet simplified presentation of industry insights and analysis to meet your specific requirements effectively.
We ensure that you get unmatchable competitive advantage by providing detailed insights about the existing market scenario as well as the emerging and high growth markets.
Regions and Countries with the Highest Number of Returning Clients

Projects delivered with customization
Projects involving industry specific expertise
Analysts Support
Corporates choose us as their preferred partner
Commitment to Excellence
Diverse Teams
Innovative Solutions
Client Centric Approach
Continuous Improvement

Subscribe to our Newsletter
By subscribing you agree to with our privacy policy and provide
consent to
receive
updates
from our company.

United States (Head Office)
30 North Gould Street, Sheridan, WY 82801
+1-415-325-5166
Australia
63 Fiona Drive, Tamworth, NSW
+61 448 06 17 27
India
C130 Sector 2 Noida, Uttar Pradesh 201301
+91-120-433-0800
Philippines
40th Floor, PBCom Tower, 6795 Ayala Avenue Cor V.A Rufino St. Makati City,1226.
+63 287899028, +63 967 048 3306
United Kingdom
6 Gardner Place, Becketts Close, Feltham TW14 0BX, Greater London
+44-753-713-2163
Vietnam
193/26/4 St.no.6, Ward Binh Hung Hoa, Binh Tan District, Ho Chi Minh City
+84865399124