Consumer Insights
Uncover trends and behaviors shaping consumer choices today
Procurement Insights
Optimize your sourcing strategy with key market data
Industry Stats
Stay ahead with the latest trends and market analysis.
Base Year
Historical Year
Forecast Year


Value in KMT
2025-2034
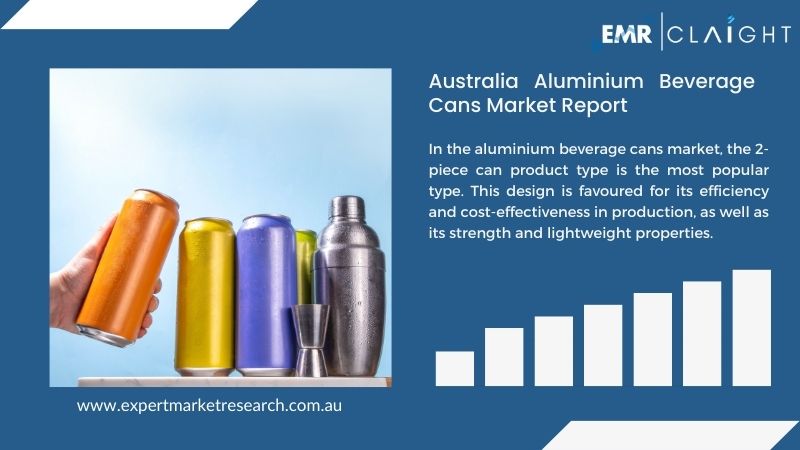
Australia Aluminium Beverage Cans Market Outlook
*this image is indicative*
Based on the application, the Australia aluminium beverage cans market share is driven by carbonated soft drinks
As per Australia aluminium beverage cans market analysis, these cans provide protection and durability by preserving the quality and freshness of soft drinks. Aluminium cans have a high recycling rate which leads to reduced energy consumption and minimises the environmental impact, thus leading to its growing adoption, driving the Australia aluminium beverage cans market.
| Australia Aluminium Beverage Cans Market Report Summary | Description | Value |
| Base Year | KMT | 2024 |
| Historical Period | KMT | 2018-2024 |
| Forecast Period | KMT | 2025-2034 |
| Market Size 2024 | KMT | 97.22 |
| Market Size 2034 | KMT | 131.93 |
| CAGR 2018-2024 | Percentage | XX% |
| CAGR 2025-2034 | Percentage | 3.10% |
| CAGR 2025-2034 - Market by Region | Western Australia | 4.1% |
| CAGR 2025-2034 - Market by Region | Australian Capital Territory | 3.7% |
| CAGR 2025-2034 - Market by Application | Energy Drinks | 4.3% |
| CAGR 2025-2034 - Market by Type | 2-Piece | 3.3% |
| Market Share by Region 2024 | Queensland | 18.7% |
According to the Australian Aluminium Council Ltd, approximately 44 kilotonnes are recycled back into cans from the total scrap generated every year. The can-to-can recycling rate has been estimated to be 48%.
The ongoing concern regarding the reduction in environmental impact and energy consumption has been driving the Australia aluminium beverage cans market growth as the Australian government has implemented container deposit schemes in 6/8 states which led to the collection of a high proportion of cans across Australia that is expected to eventually increase the recycling capacity.
"Australia Aluminium Beverage Cans Market Report and Forecast 2025-2034" offers a detailed analysis of the market based on the following segments:
Market Breakup by Type
Market Breakup by Application
Market Breakup by Region
In the aluminium beverage cans market, the 2-piece can product type is the most popular type. This design is favoured for its efficiency and cost-effectiveness in production, as well as its strength and lightweight properties. The 2-piece can make it easier to manufacture and recycle compared to the 3-piece design. Its widespread use in the beverage industry, particularly for soft drinks and beer, determined its prominence in the market.
| CAGR 2025-2034 - Market by | Region |
| Western Australia | 4.1% |
| Australian Capital Territory | 3.7% |
| Victoria | 3.2% |
| New South Wales | XX% |
| Queensland | XX% |
| Others | XX% |
The growth of the aluminium beverage cans market is fuelled by growing with an increasing recycling rate, increasing use of cans for packaging and new government initiatives.
*While we strive to always give you current and accurate information, the numbers depicted on the website are indicative and may differ from the actual numbers in the main report. At Expert Market Research, we aim to bring you the latest insights and trends in the market. Using our analyses and forecasts, stakeholders can understand the market dynamics, navigate challenges, and capitalize on opportunities to make data-driven strategic decisions.*
Get in touch with us today for customized, data-driven solutions tailored to your unique requirements!
The Australia aluminium beverage cans market was valued at 97.22 KMT in 2024.
The market is projected to grow at a CAGR of 3.10% between 2025 and 2034.
The market is expected to reach 131.93 KMT in 2034.
Based on the type, the aluminium beverage cans market is bifurcated into 3-piece, 2-piece, and 1-piece.
Key players in the industry are Crown Holdings, Inc., Orora Packaging Australia Pty Ltd., PrimePac, and Visy Industries Australia Pty Ltd. among others.
The different distribution channels in the aluminium beverage cans market include beer, water, energy drinks, carbonated soft drinks, and others.
The market is broken down into New South Wales, Victoria, Queensland, Australian Capital Territory, Western Australia, and others.
Explore our key highlights of the report and gain a concise overview of key findings, trends, and actionable insights that will empower your strategic decisions.
| Report Features | Details |
| Base Year | 2024 |
| Historical Period | 2018-2024 |
| Forecast Period | 2025-2034 |
| Scope of the Report |
Historical and Forecast Trends, Industry Drivers and Constraints, Historical and Forecast Market Analysis by Segment:
|
| Breakup by Type |
|
| Breakup by Application |
|
| Breakup by Region |
|
| Market Dynamics |
|
| Competitive Landscape |
|
| Companies Covered |
|
Our step-by-step guide will help you select, purchase, and access your reports swiftly, ensuring you get the information that drives your decisions, right when you need it.

Choose the right license for your needs and access rights.

Add the report to your cart with one click and proceed to register.

Choose a payment option for a secure checkout. You will be redirected accordingly.
Pricing Plans


One User
Five Users
Unlimited Users
Our expert team of analysts will offer full support and resolve any queries regarding the report, before and after the purchase.
Our expert team of analysts will offer full support and resolve any queries regarding the report, before and after the purchase.
We employ meticulous research methods, blending advanced analytics and expert insights to deliver accurate, actionable industry intelligence, staying ahead of competitors.
Our skilled analysts offer unparalleled competitive advantage with detailed insights on current and emerging markets, ensuring your strategic edge.
We offer an in-depth yet simplified presentation of industry insights and analysis to meet your specific requirements effectively.
We ensure that you get unmatchable competitive advantage by providing detailed insights about the existing market scenario as well as the emerging and high growth markets.
Regions and Countries with the Highest Number of Returning Clients
Projects delivered with customization
Projects involving industry specific expertise
Analysts Support
Corporates choose us as their preferred partner
Commitment to Excellence
Diverse Teams
Innovative Solutions
Client Centric Approach
Continuous Improvement

Subscribe to our Newsletter
By subscribing you agree to with our privacy policy and provide
consent to
receive
updates
from our company.
United States (Head Office)
30 North Gould Street, Sheridan, WY 82801
+1-415-325-5166
Australia
63 Fiona Drive, Tamworth, NSW
+61 448 06 17 27
India
C130 Sector 2 Noida, Uttar Pradesh 201301
+91-120-433-0800
Philippines
40th Floor, PBCom Tower, 6795 Ayala Avenue Cor V.A Rufino St. Makati City,1226.
+63 287899028, +63 967 048 3306
United Kingdom
6 Gardner Place, Becketts Close, Feltham TW14 0BX, Greater London
+44-753-713-2163
Vietnam
193/26/4 St.no.6, Ward Binh Hung Hoa, Binh Tan District, Ho Chi Minh City
+84865399124